DeepGDel
IEEE TCBB 2025
A deep learning framework that learns gene and metabolite sequence representations to predict gene deletion strategies for growth-coupled production.
Graph representation learning for growth-coupled gene deletion prediction
GraphGDel turns a genome-scale metabolic model into a metabolite graph and learns from it, together with gene and metabolite sequences, to predict which genes to delete so that a cell's growth is coupled to the production of a target metabolite.
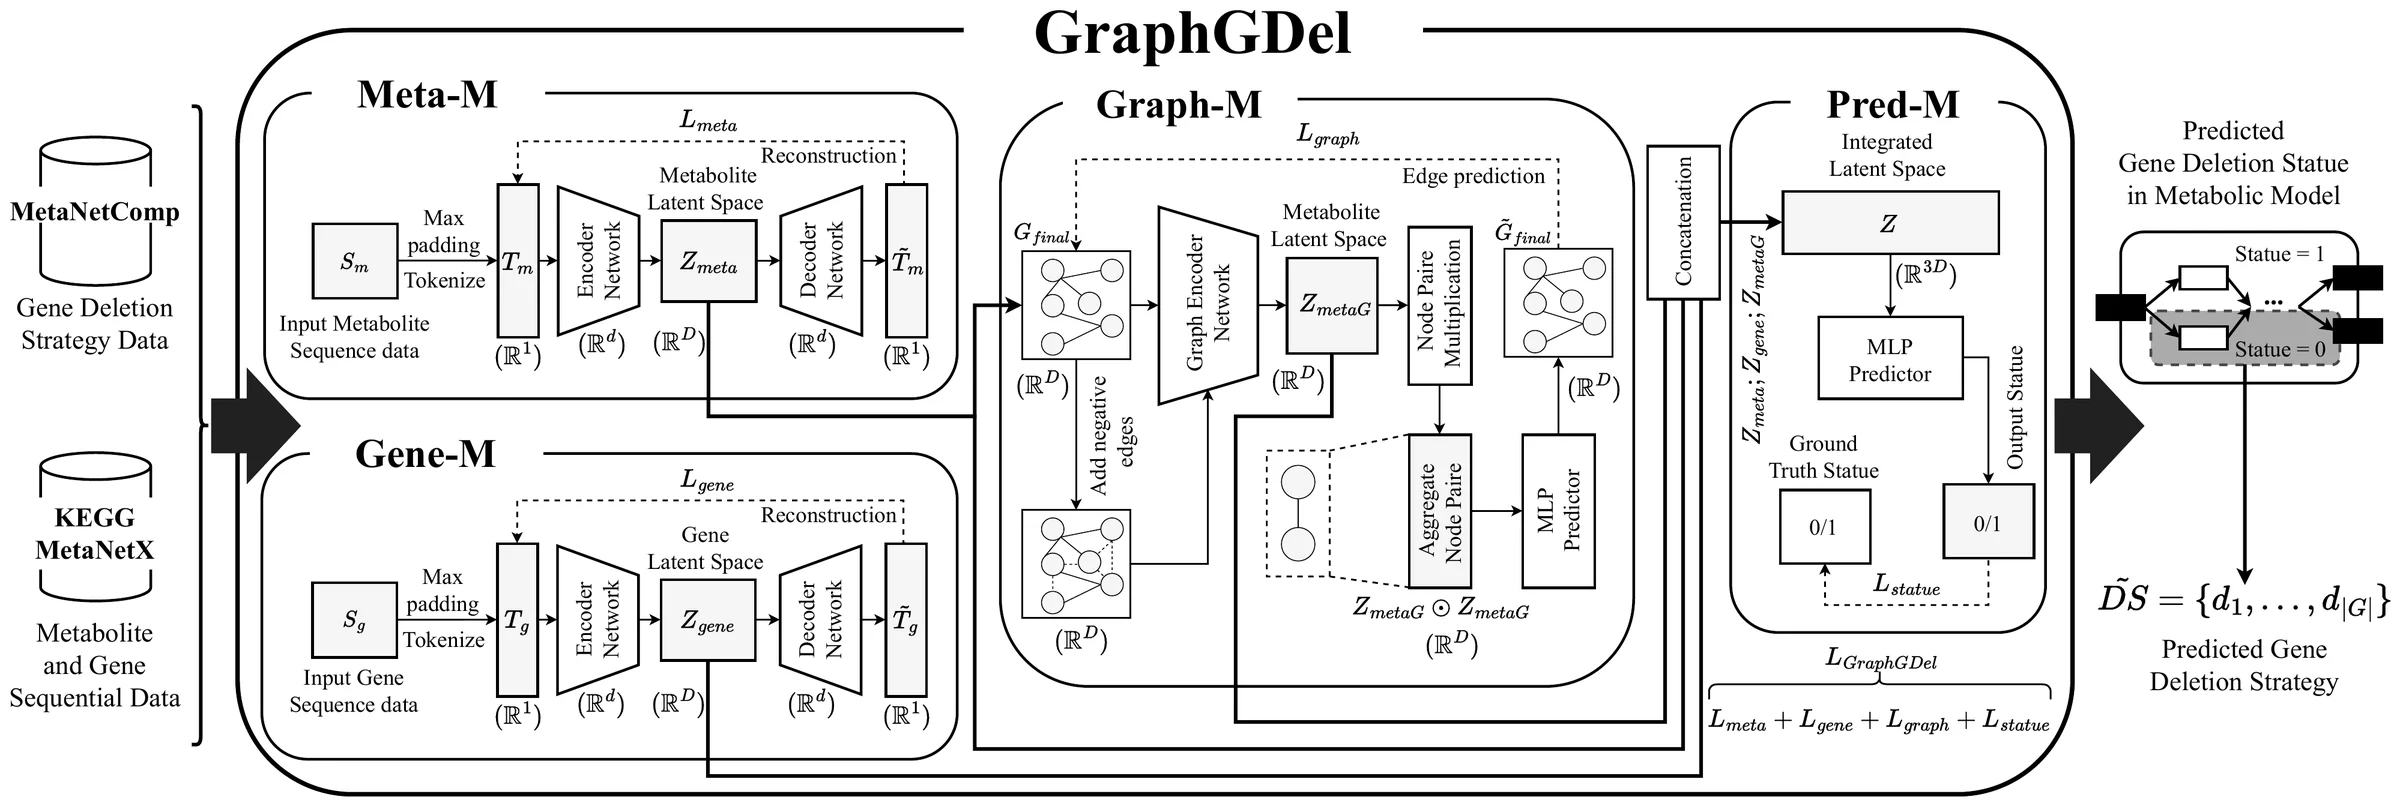
Metabolic engineers use genome-scale metabolic models to design microbial strains. A central goal is growth-coupled production: deleting genes so that a cell can only grow while also making a target compound. Because faster-growing strains take over during repeated passaging, coupling keeps production stable. Computing such gene deletion strategies from scratch is expensive for genome-scale models.
Our earlier DeepGDel turned this into a prediction task learned from databases of known strategies, but it saw genes and metabolites only as sequences and ignored how metabolites are connected through reactions. Metabolic models do not come with a ready-made graph: they are written as stoichiometric matrices, gene–protein–reaction rules and flux bounds.
GraphGDel addresses both. It builds a metabolite graph from the model, filtering out hub and currency metabolites such as ATP and NADH, and combines graph learning with sequence learning to predict which genes to delete or keep for each target metabolite.
Two contributions: a pipeline that constructs graphs from constraint-based metabolic models, and a learning framework that uses them.
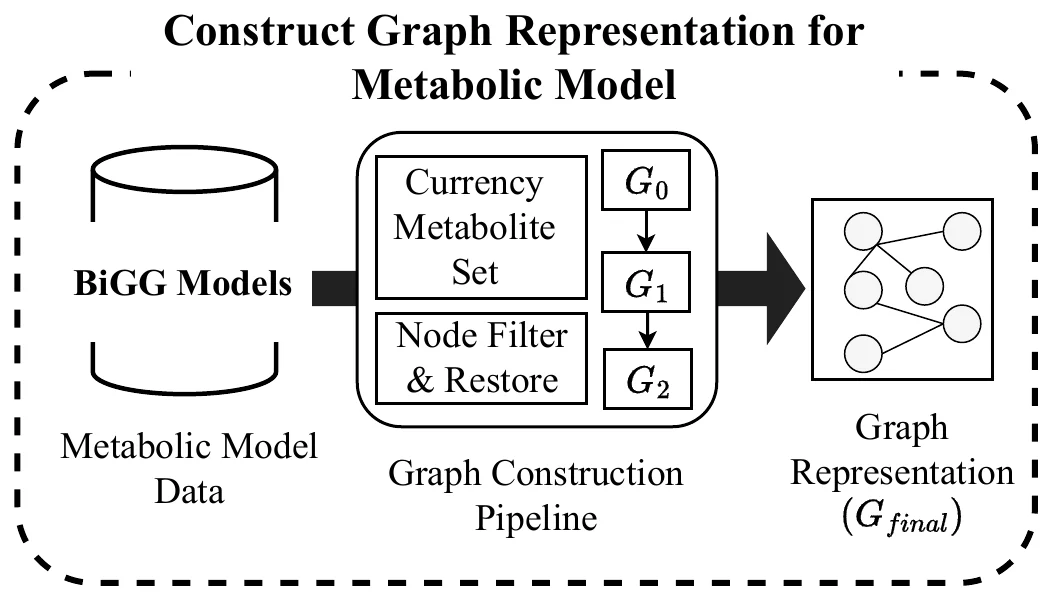
Read the model as a network of metabolites, reactions and genes, link each substrate to each product, then remove the ten highest-degree hubs and known currency metabolites, restoring targets and non-currency hubs.
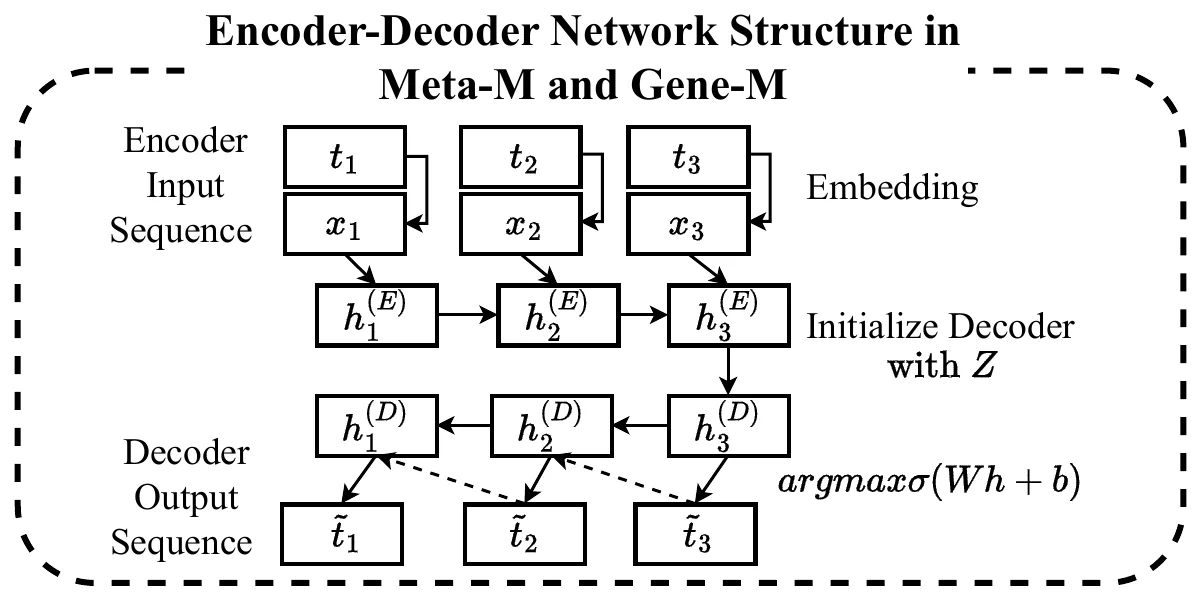
Meta-M and Gene-M are LSTM autoencoders that compress metabolite SMILES strings and gene amino-acid sequences into latent representations.
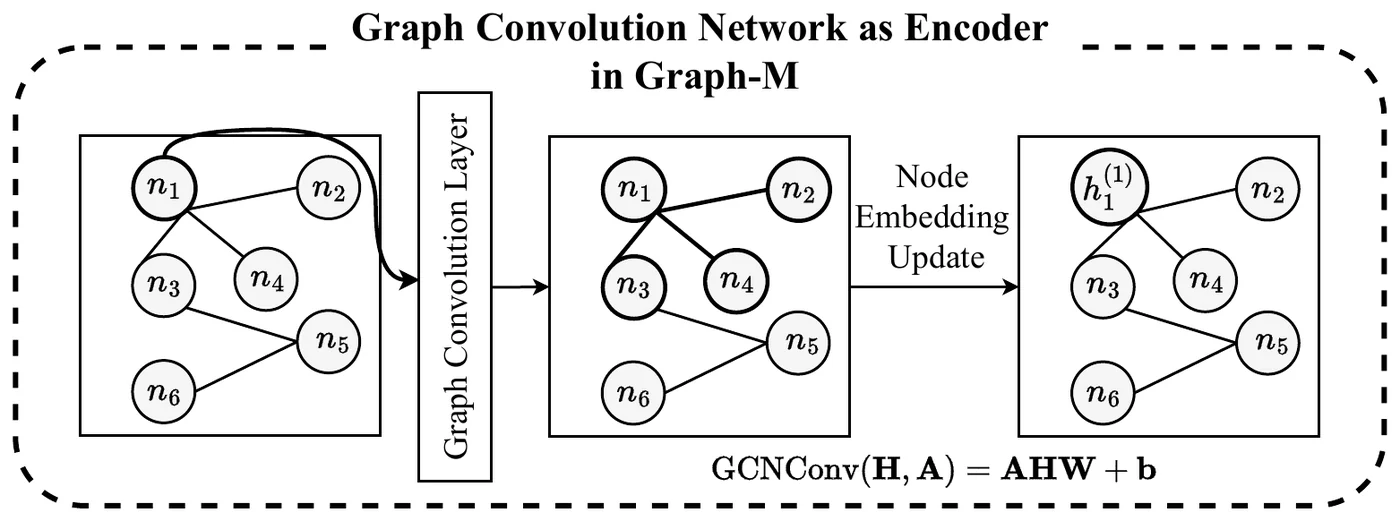
Graph-M, a graph convolutional network trained by link prediction, refines metabolite features in their network context. Pred-M combines all three representations to predict whether each gene is deleted or kept.
Figure adapted from Yang & Tamura, IEEE TCBB 2026.
Overall accuracy
Overall accuracy of gene deletion status prediction on three metabolic models (mean of 5 × 10-fold cross-validation): 14.04, 16.26 and 13.18 points above a deep neural network baseline, and ahead of DeepGDel and a graph-aggregation baseline on all five metrics.
GraphGDel: Constructing and Learning Graph Representations of Genome-Scale Metabolic Models for Growth-Coupled Gene Deletion Prediction