Ziwei Yang, Ph.D.
02 · Understand Biology · Multimodal Biomedical AI

MLOmics

A machine-learning-ready cancer multi-omics database

MLOmics turns TCGA cancer multi-omics data into task-ready datasets for machine learning: 8,314 patient samples across 32 cancer types, four omics types, 20 benchmark tasks with baselines, and links to biological knowledge bases.
Cancer Multi-OmicsDatasets & Benchmarks Ziwei Yang, Rikuto Kotoge, Xihao Piao, Zheng Chen, Lingwei Zhu, Peng Gao, Yasuko Matsubara, Yasushi Sakurai, Jimeng Sun · Scientific Data, 2025
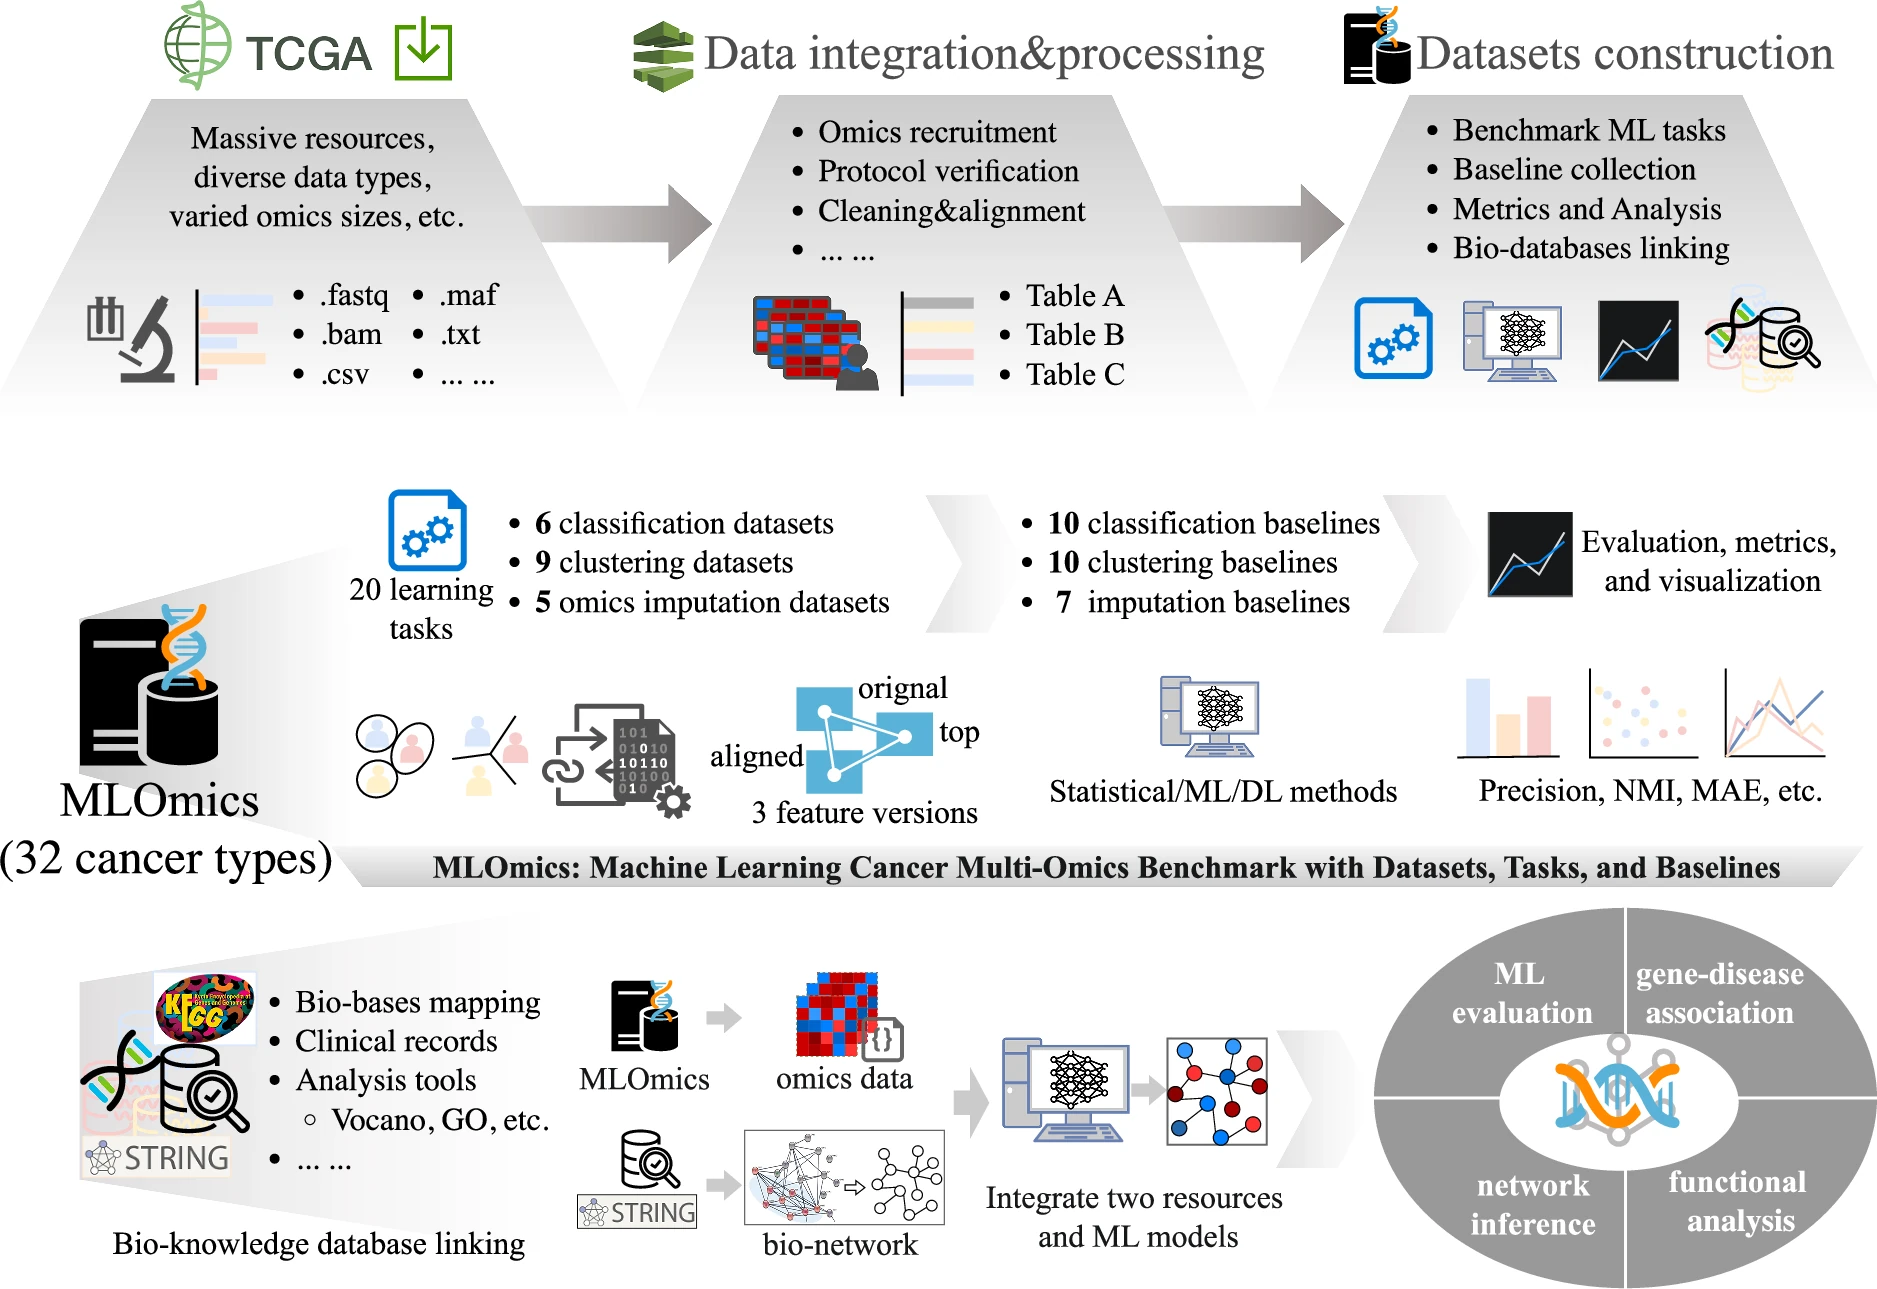
MLOmics workflow: massive TCGA resources in diverse formats go through data integration and processing and then dataset construction; MLOmics covers 32 cancer types with 20 learning tasks (6 classification, 9 clustering, 5 imputation datasets), three feature versions, statistical, ML and deep-learning baselines, and links to bio-knowledge databases such as STRING and KEGG.
How MLOmics was built. Patient samples from TCGA are integrated and processed into four omics types, then organised into 20 learning tasks with baselines, metrics and links to knowledge bases such as STRING and KEGG. Figure adapted from Yang et al., Scientific Data 2025 (CC BY 4.0).

Overview

Public portals such as TCGA hold rich cancer multi-omics data, but it is not ready for machine learning. Files are scattered across repositories, each omics type needs its own preprocessing, and samples have to be linked to metadata by hand. Published models are often evaluated on differently processed data, which makes them hard to compare.

MLOmics does this work once. It collects 8,314 patient samples covering all 32 TCGA cancer types, processes mRNA, microRNA, DNA methylation and copy-number data with one pipeline, and ships them as CSV files in three feature versions: Original, Aligned (genes shared across cancers) and Top (the most significant features by ANOVA).

On top of the data it defines tasks for classification, clustering and imputation, with reproduced baselines and standard metrics, plus tools for downstream analysis such as survival analysis and volcano plots.

What's inside

Twenty task-ready datasets in four task categories, built in three stages.

20 task-ready datasets
1
Pan-cancer classification
Identify each patient's cancer type
Pan-cancer
5
Gold-standard subtype classification
Subtypes widely accepted in prior research
GS-BRCAGS-COADGS-GBMGS-LGGGS-OV
9
Cancer subtype clustering
Unlabelled rare-cancer datasets
ACCKIRPKIRCLIHCLUADLUSCPRADTHCATHYM
5
Omics data imputation
Values masked at random at 30%, 50% or 70%
Imp-BRCAImp-COADImp-GBMImp-LGGImp-OV
Task categories and datasets from Supplementary Table 3 of the paper. The classification and clustering datasets come in Original, Aligned and Top feature versions (Supplementary Table 2). Redrawn.
  1. 01

    Collect and process

    Download TCGA data from the GDC portal and apply omics-specific steps, such as FPKM conversion and log transforms for mRNA and miRNA, recurrent-alteration calling for copy number, and median-centring normalisation and promoter selection for methylation.

  2. 02

    Align and select features

    Unify gene IDs and align the omics by sample. The Aligned version keeps genes shared across cancers; the Top version keeps features that pass a multi-class ANOVA with Benjamini–Hochberg correction.

  3. 03

    Benchmark and link

    Each task comes with reproduced baselines (6 to 10 per task) and metrics, downstream analysis tools, and offline links to knowledge bases such as STRING and KEGG.

Key Results

What's in the database

8,314
patient samples
from TCGA
32
cancer types
all TCGA cancer types
20
task-ready datasets
classification, clustering, imputation

Each patient has four omics types: mRNA expression, microRNA expression, DNA methylation and copy-number variation. The main datasets are released under CC BY 4.0.

Benchmark

Baseline results on the six classification datasets.

Precision: statistical vs machine-learning baselines Statistical (4 methods)Machine learning (6 methods)
Pan-cancer 0.79–0.820.84–0.91
GS-BRCA 0.71–0.760.84–0.87
GS-COAD 0.73–0.770.85–0.93
GS-GBM 0.72–0.760.82–0.95
GS-LGG 0.73–0.770.83–0.94
GS-OV 0.72–0.760.84–0.95
Each bar spans the lowest to highest precision within a group of baselines. Statistical: SVM, XGBoost, RF, LR. Machine learning: Subtype-GAN, DCAP, MAUI, XOmiVAE, CustOmics, DeepCC (grouping as in the paper's Fig. 3 caption). Values read from the labelled bars of Fig. 3a; redrawn.

Resources

Paper

MLOmics: Cancer Multi-Omics Database for Machine Learning

Scientific Data 12, 913 (2025) · open access

Code

chenzRG/Cancer-Multi-Omics-Benchmark

Preprocessing code and benchmark baselines

Data

MLOmics main datasets

CSV files, CC BY 4.0