MLOmics
Scientific Data 2025
An open, machine-learning-ready cancer multi-omics database: 8,314 patient samples across 32 cancer types with four omics types, stratified features and baselines.
Subtype-specific gene networks from patient data and prior knowledge
GeSubNet learns a separate gene interaction network for each disease subtype by combining patient gene expression with general gene networks from knowledge bases, so that differences between subtypes show up as differences in gene interactions.
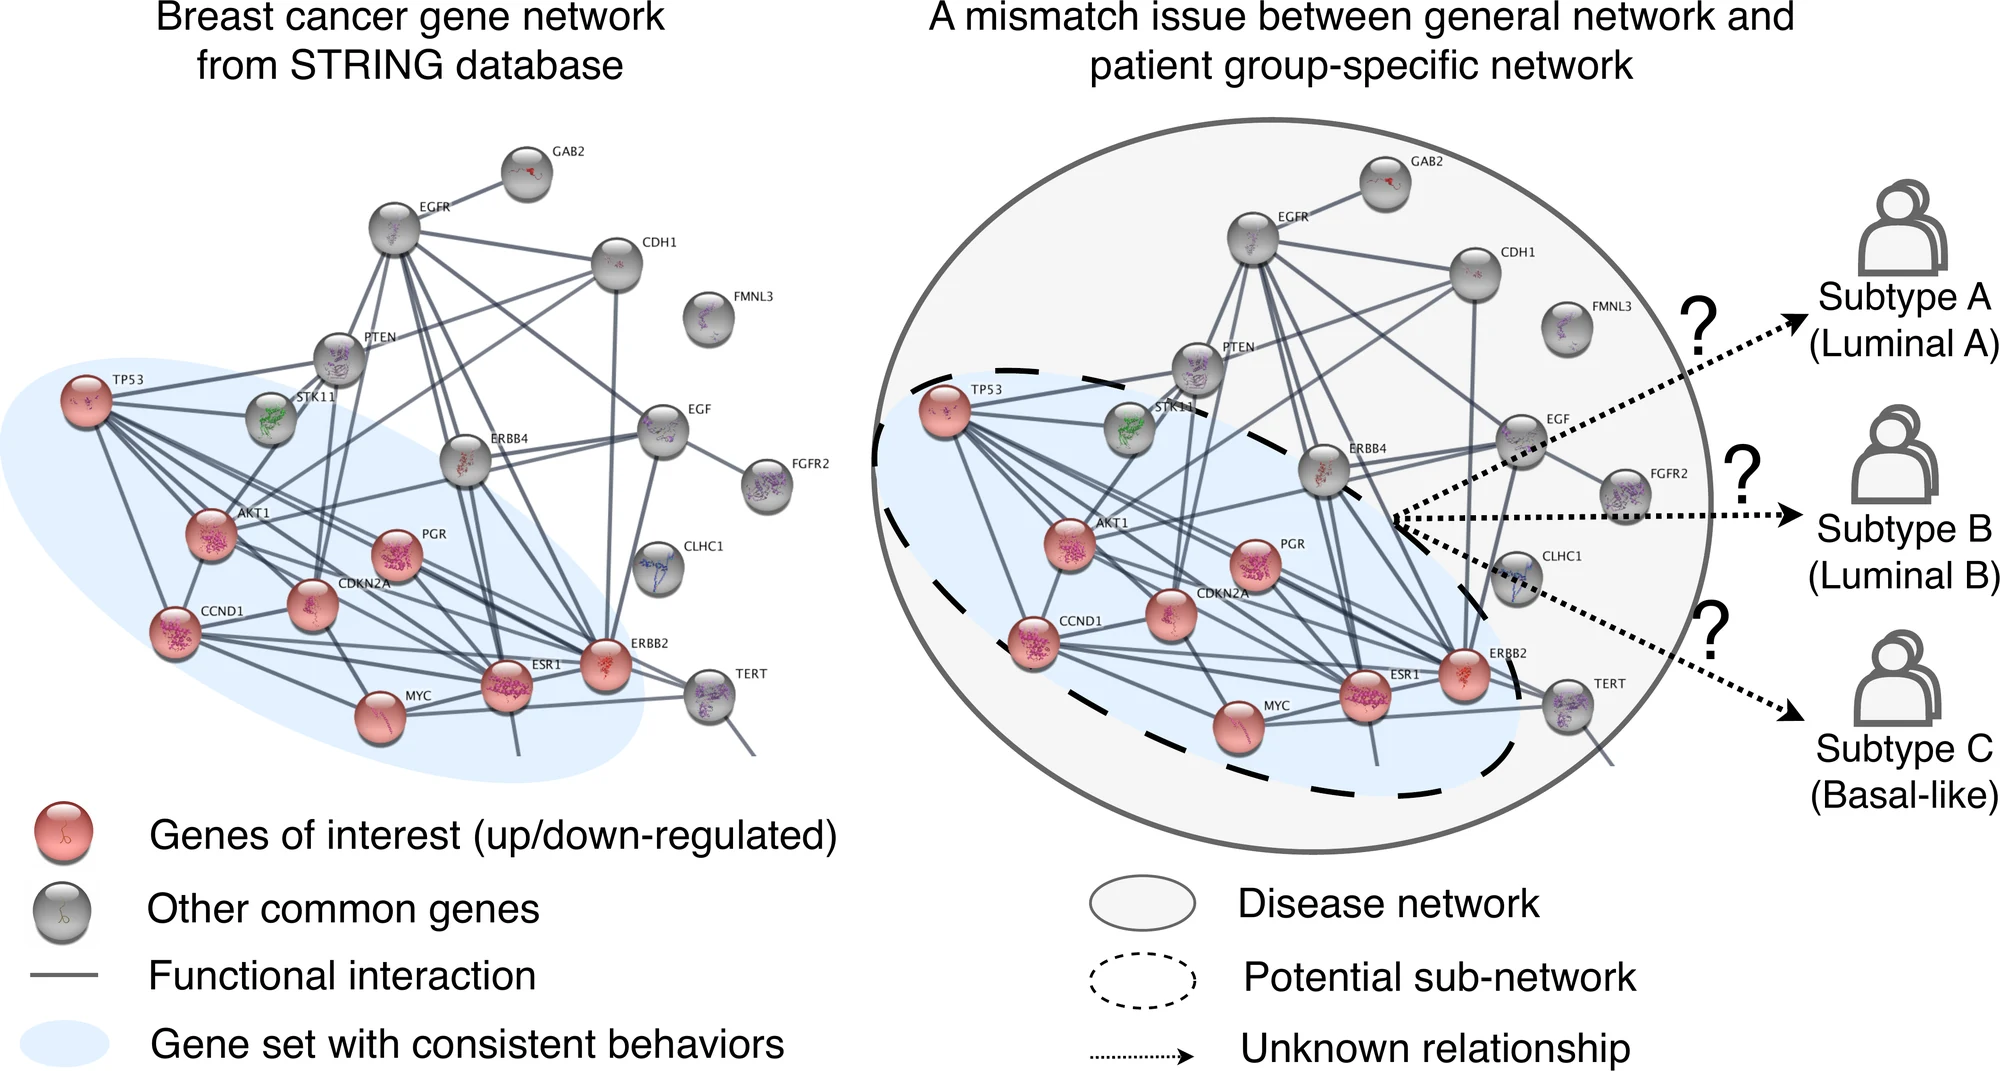
Cancers such as breast cancer split into subtypes that differ in prognosis and treatment response. Knowledge bases such as STRING and KEGG describe how genes interact in general, but those networks are the same for every patient and do not show which interactions matter in a given subtype.
GeSubNet brings the two sources together. It learns patient representations that separate subtypes from gene expression data, learns gene representations from a prior gene network, and then combines them to infer one gene interaction network per subtype.
The inferred networks also rank genes for each subtype. In simulated knockouts, removing GeSubNet's top-ranked genes moved patients away from their subtype far more often than removing the genes chosen by the baselines.
Three modules, trained in three phases.
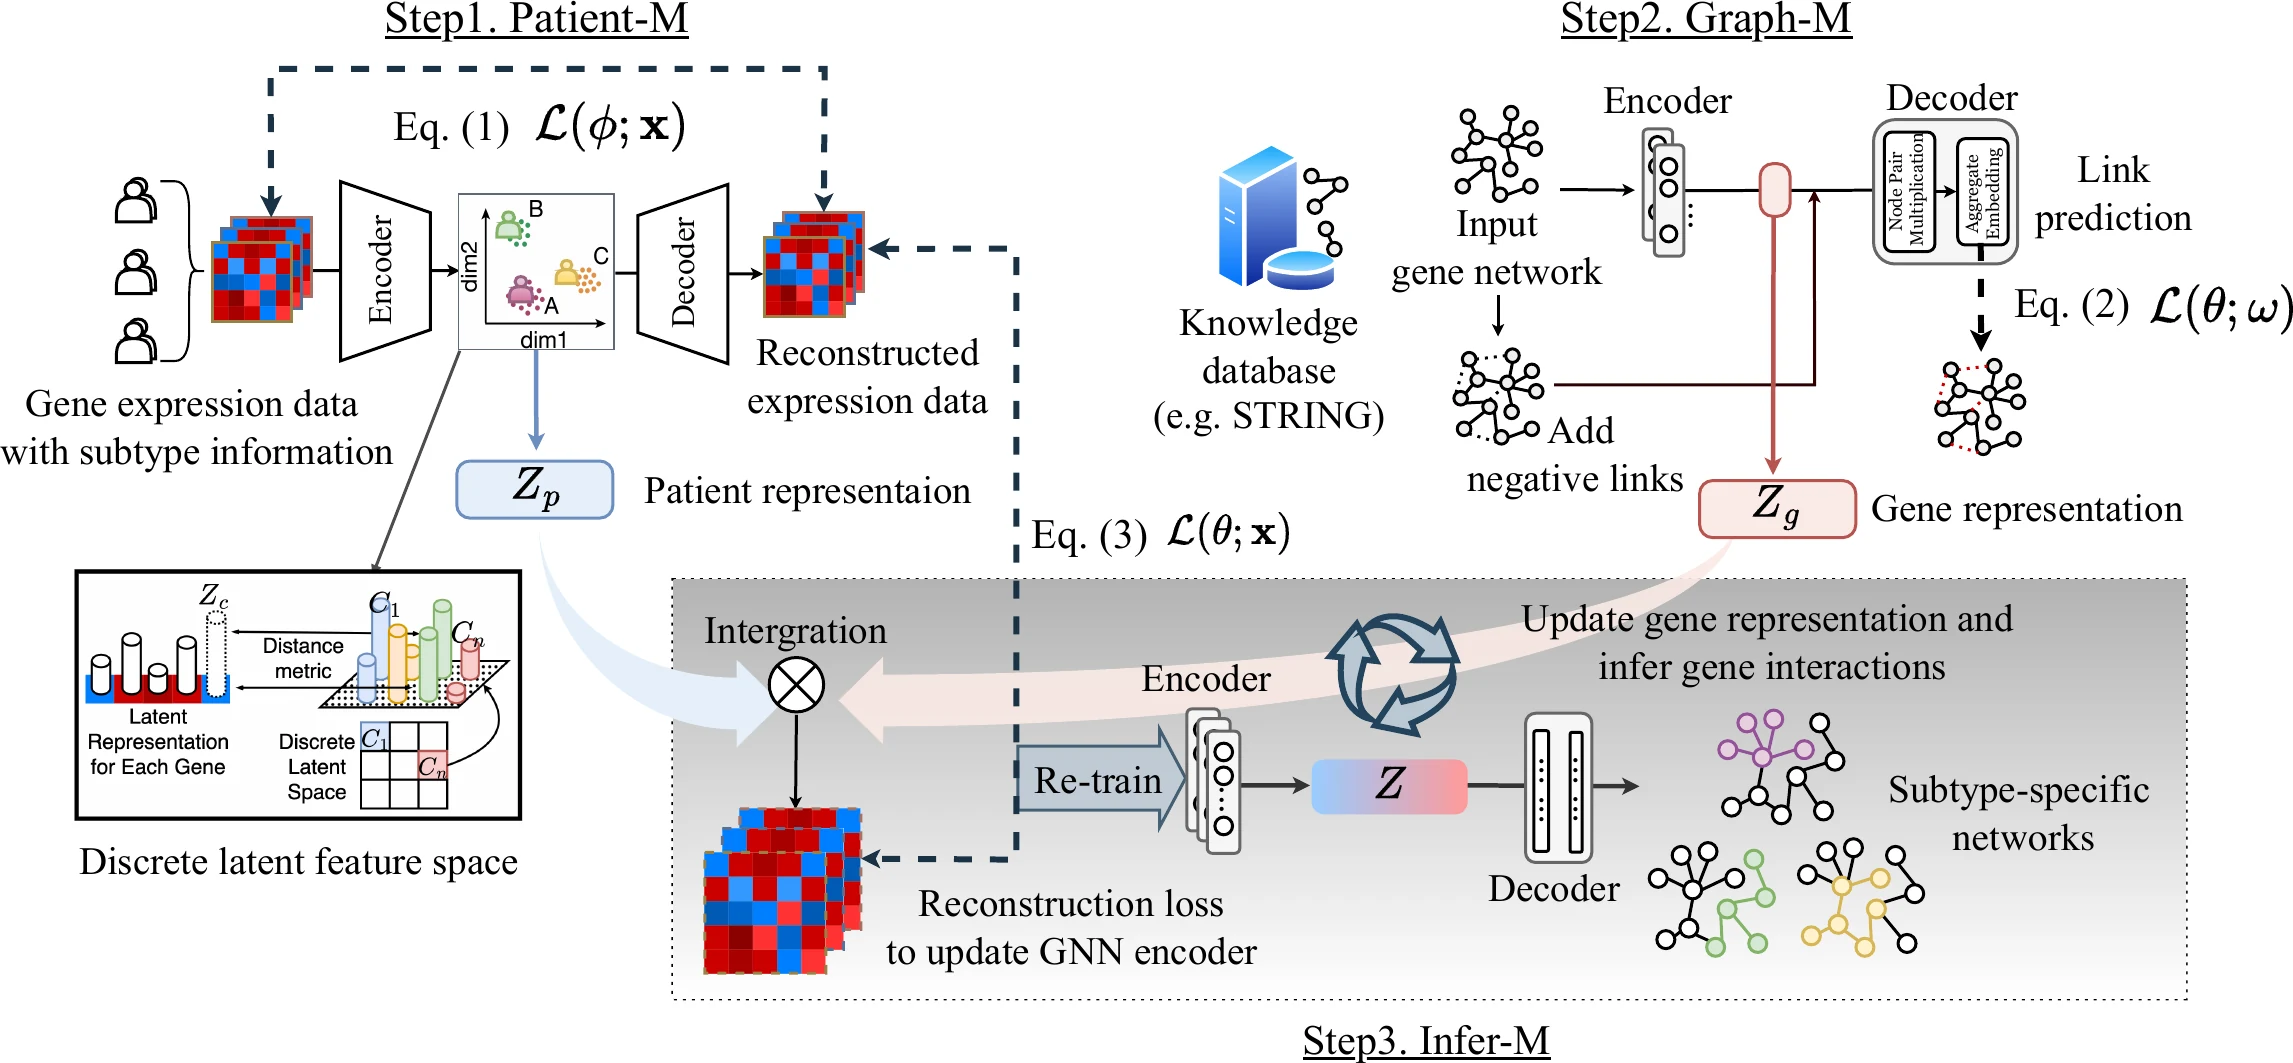
A VQ-VAE learns patient representations from gene expression profiles in a discrete latent space where subtypes can be told apart.
A graph neural network is trained by link prediction on a known gene network for the cancer, giving one representation per gene.
Patient and gene representations are combined to reconstruct expression data. The reconstruction loss retrains the GNN encoder, and the decoder then outputs a gene network for each subtype.
Simulated gene knockout, breast cancer (BRCA, 11,327 genes)
The shift rate is the share of patient samples whose profile shifts significantly when a set of genes is knocked out. GeSubNet also scored best on all three graph metrics (CDV, GED and DCS) in all four cancers.